Complete with building commissioning analytics, greenhouse gas emissions computations, ENERGY STAR integration, energy savings measurement, and more, Enpira is an indispensable tool for energy management initiatives.
LEARN MORE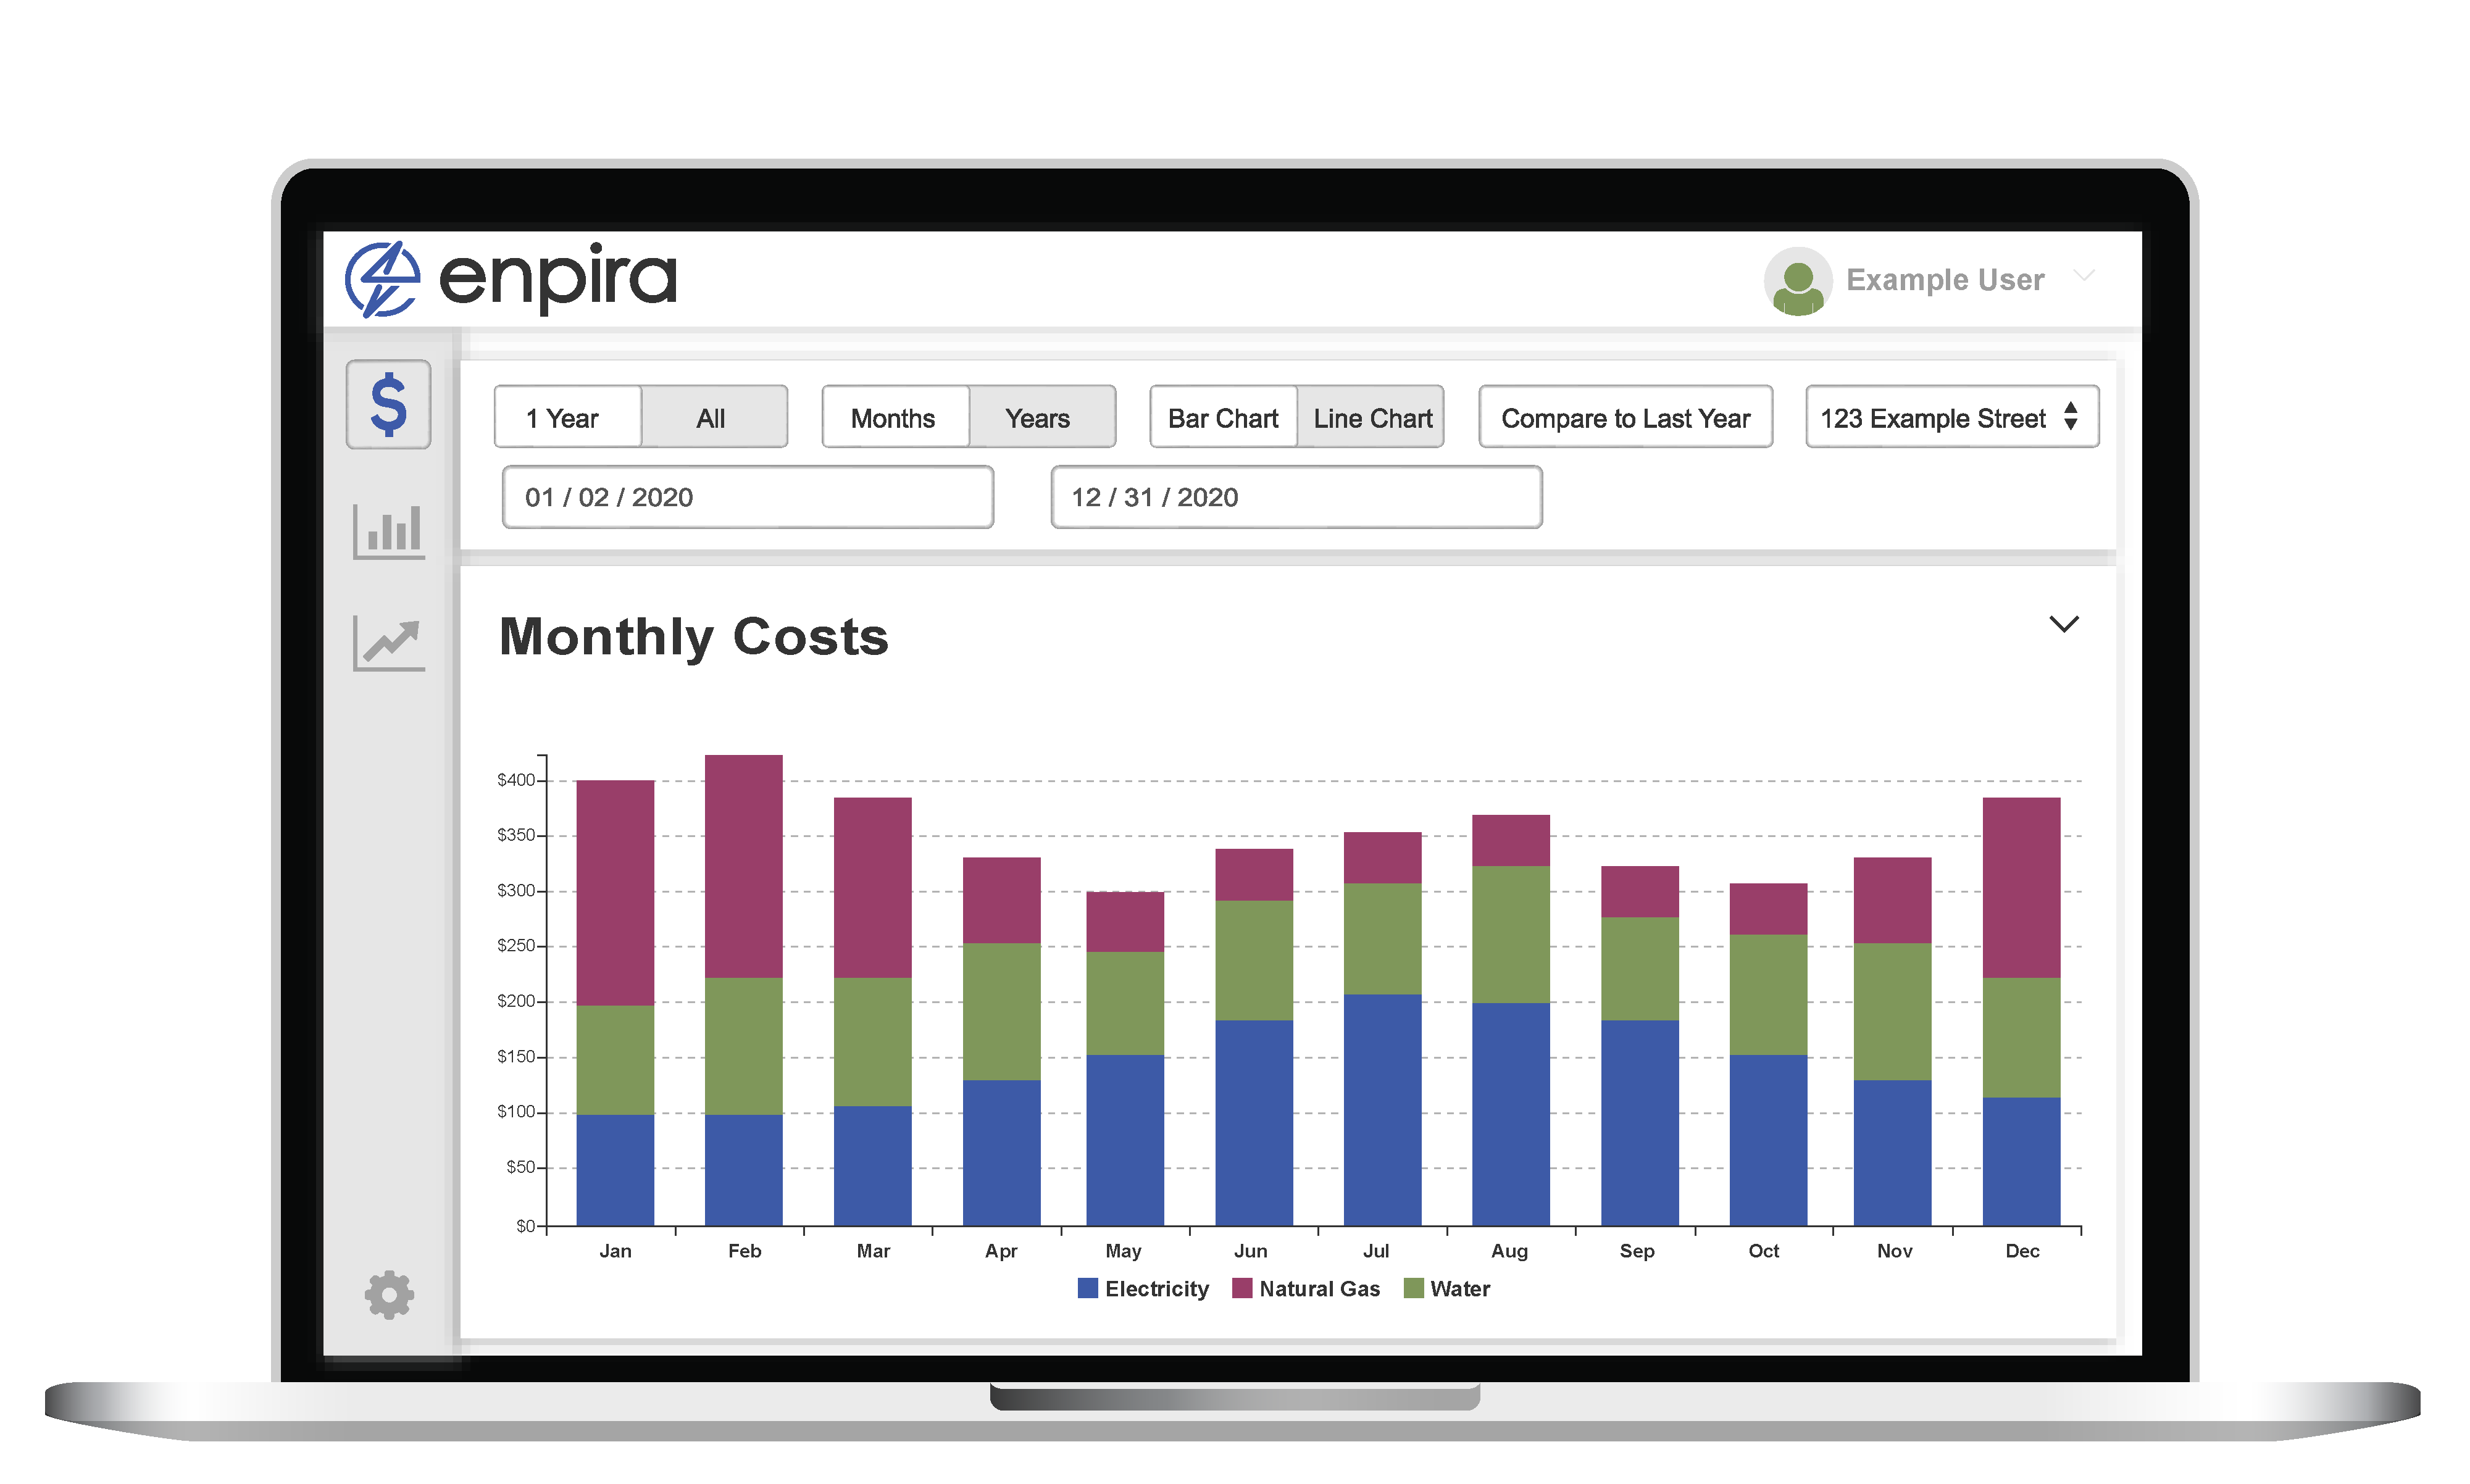

Collect and store all utility data in one place. Find savings opportunities across your whole portfolio. Track energy and emissions savings over time.

Benchmark schools against one another. Effectively allocate your facility management team by prioritizing schools with the most savings potential.

Easily manage your energy and water data. Simplify reporting, compliance, and spend analysis. Ensure high performance buildings are performing optimally.
Do you know where your savings opportunities are hiding?
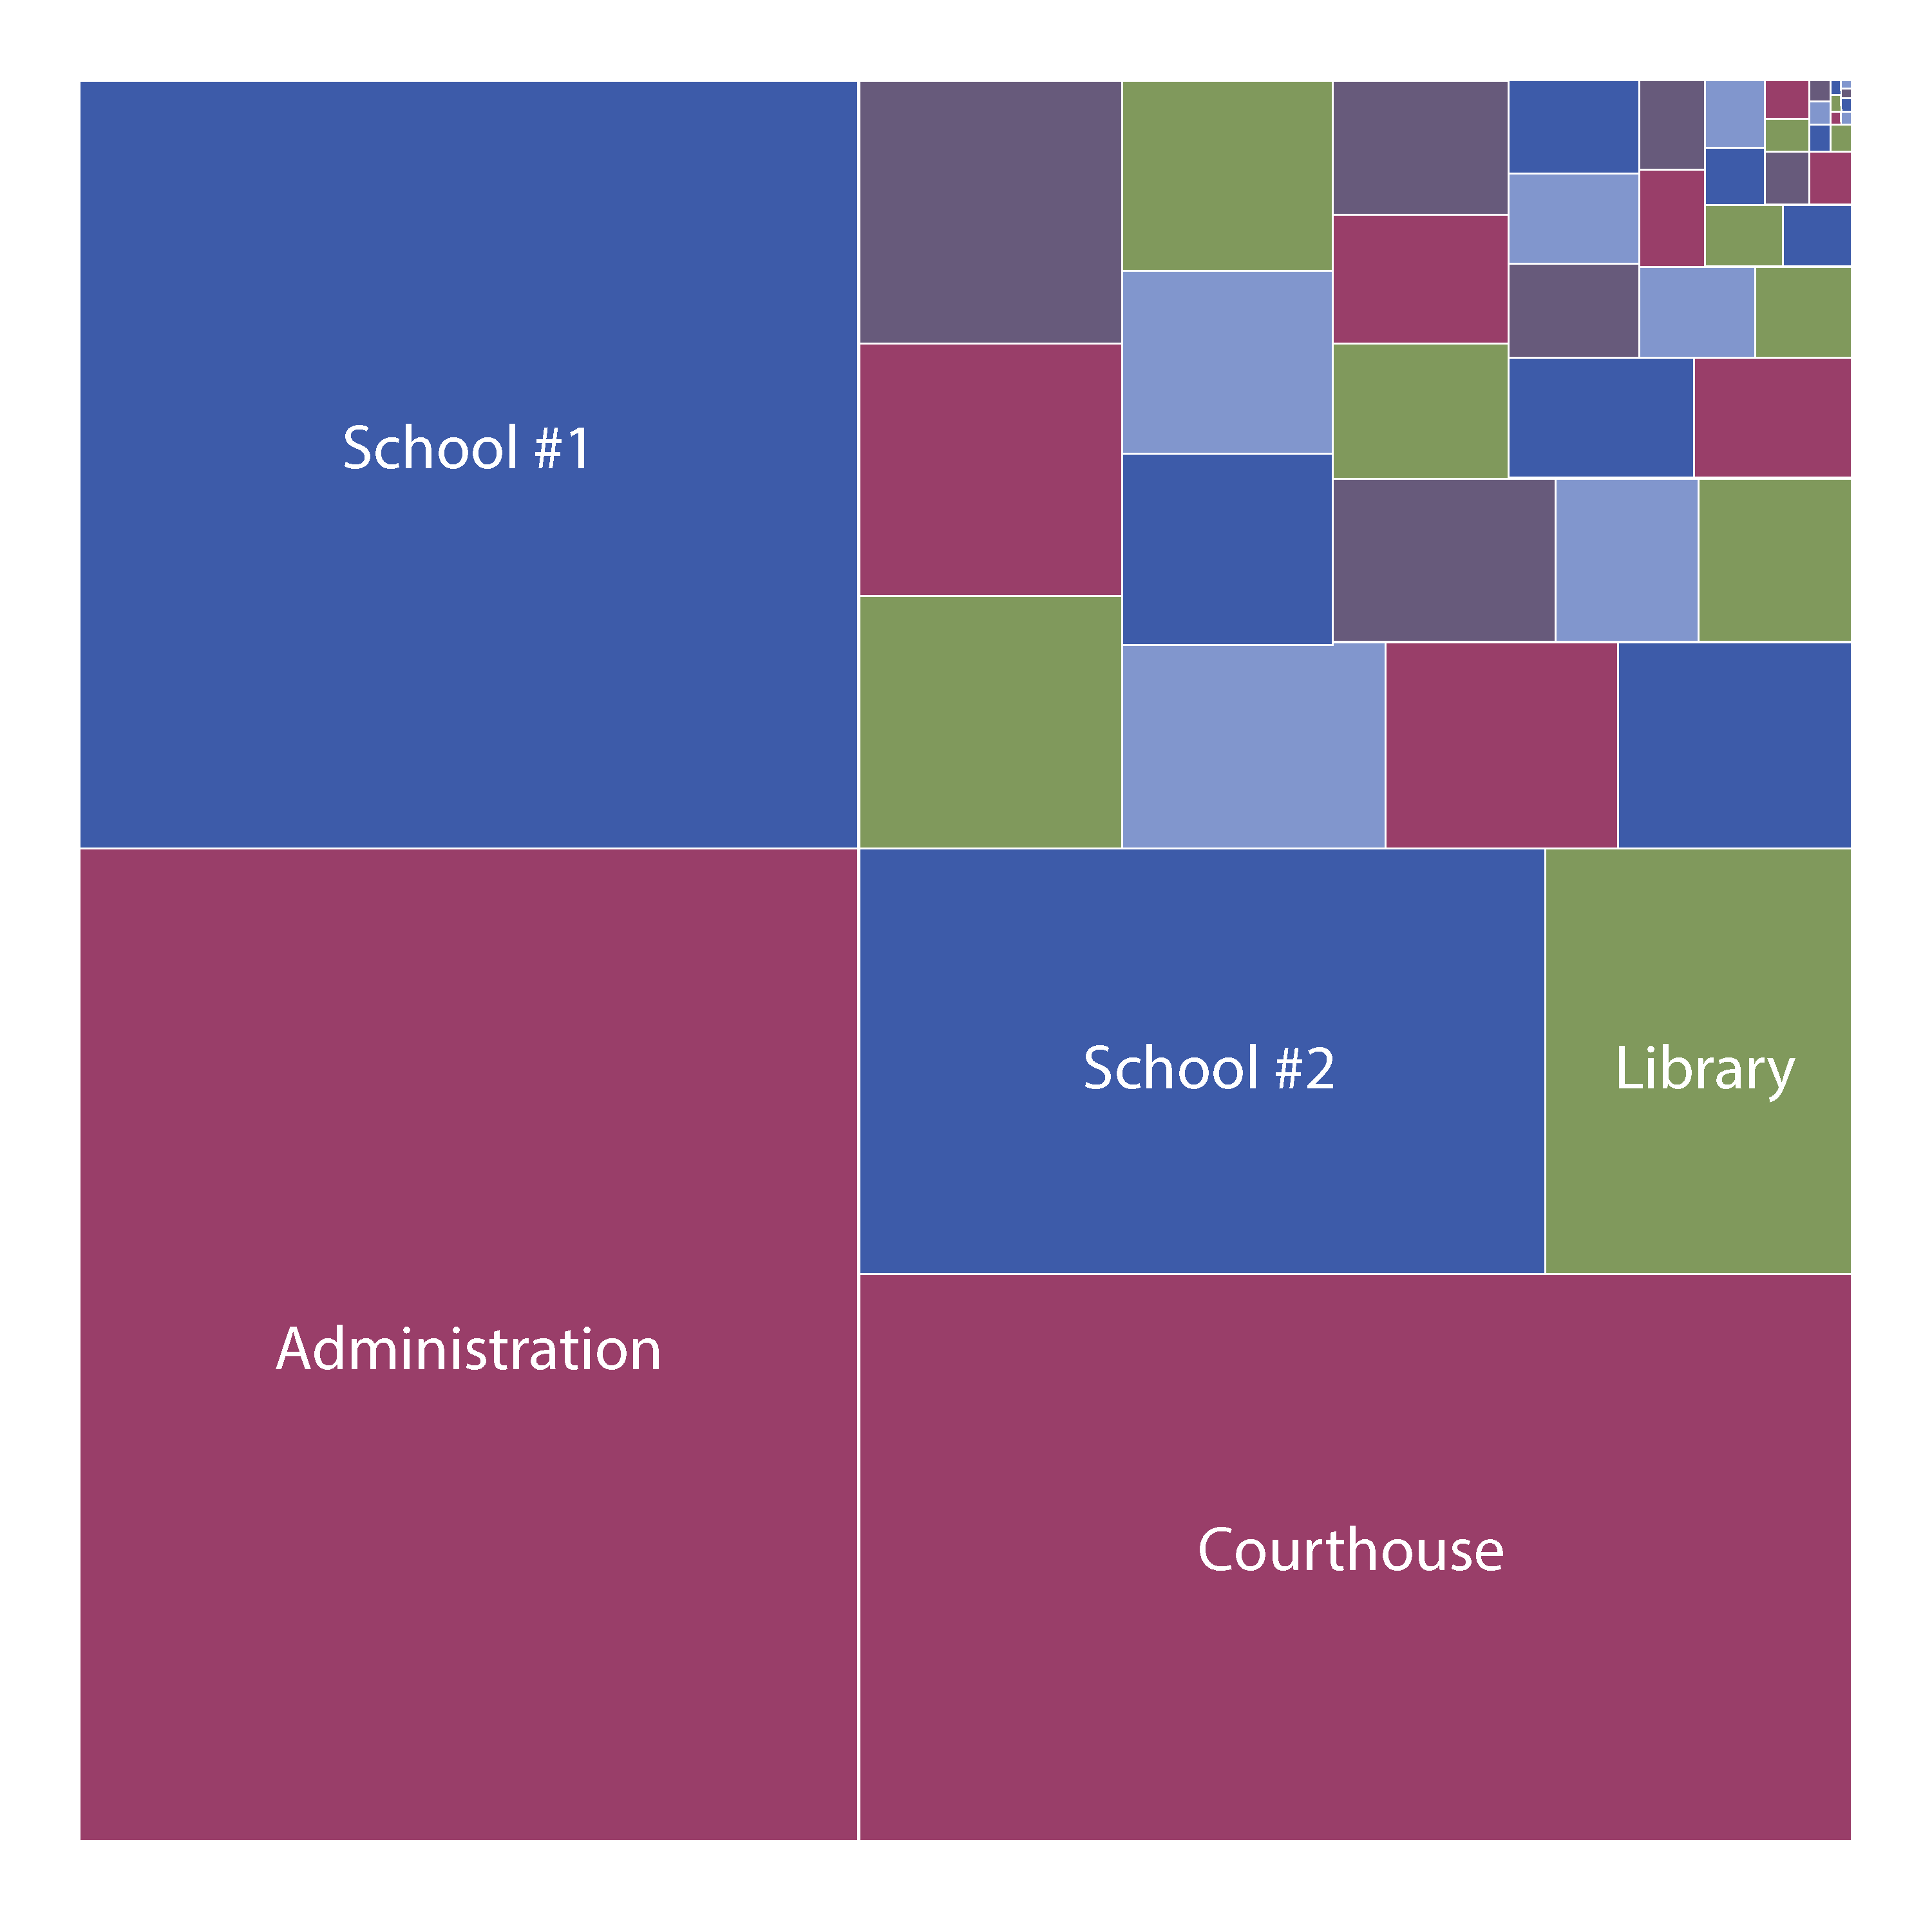
Energy savings are hiding throughout your portfolio, so begin your energy analysis with a portfolio-wide perspective. Clearly see which buildings in your portfolio are the highest energy users over time.
Benchmark your buildings to national averages using our automated ENERGY STAR Portfolio Manager integration. Fine-tune your ENERGY STAR scores based operating characteristics.
Can you spot the energy and demand savings opportunities in your buildings?
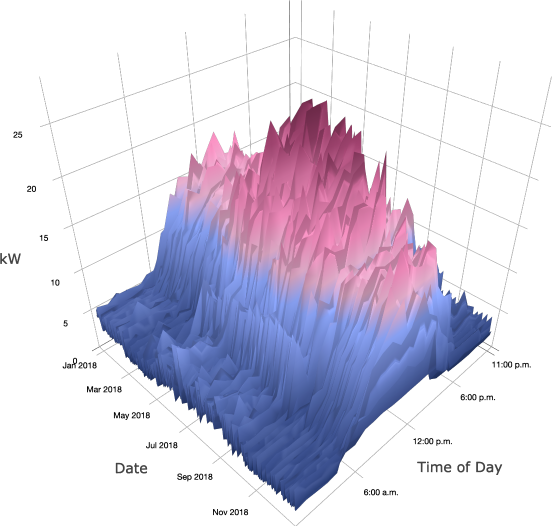
Recommissioning is the lowest hanging fruit for energy and demand savings. Over time, buildings tend to lose operational efficiency due to sensor drift, setpoint adjustments, overrides, and changing tenant needs. Typically, an energy efficiency improvement of 5-30% can be achieved with little to no capital cost through recommissioning.
Enpira’s building operation analysis enables you to easily identify recommissioning opportunities in your buildings. Once your buildings are properly commissioned, Enpira becomes your ongoing commissioning service to ensure that your buildings continue to operate at peak performance.
Are your buildings using energy as intended?
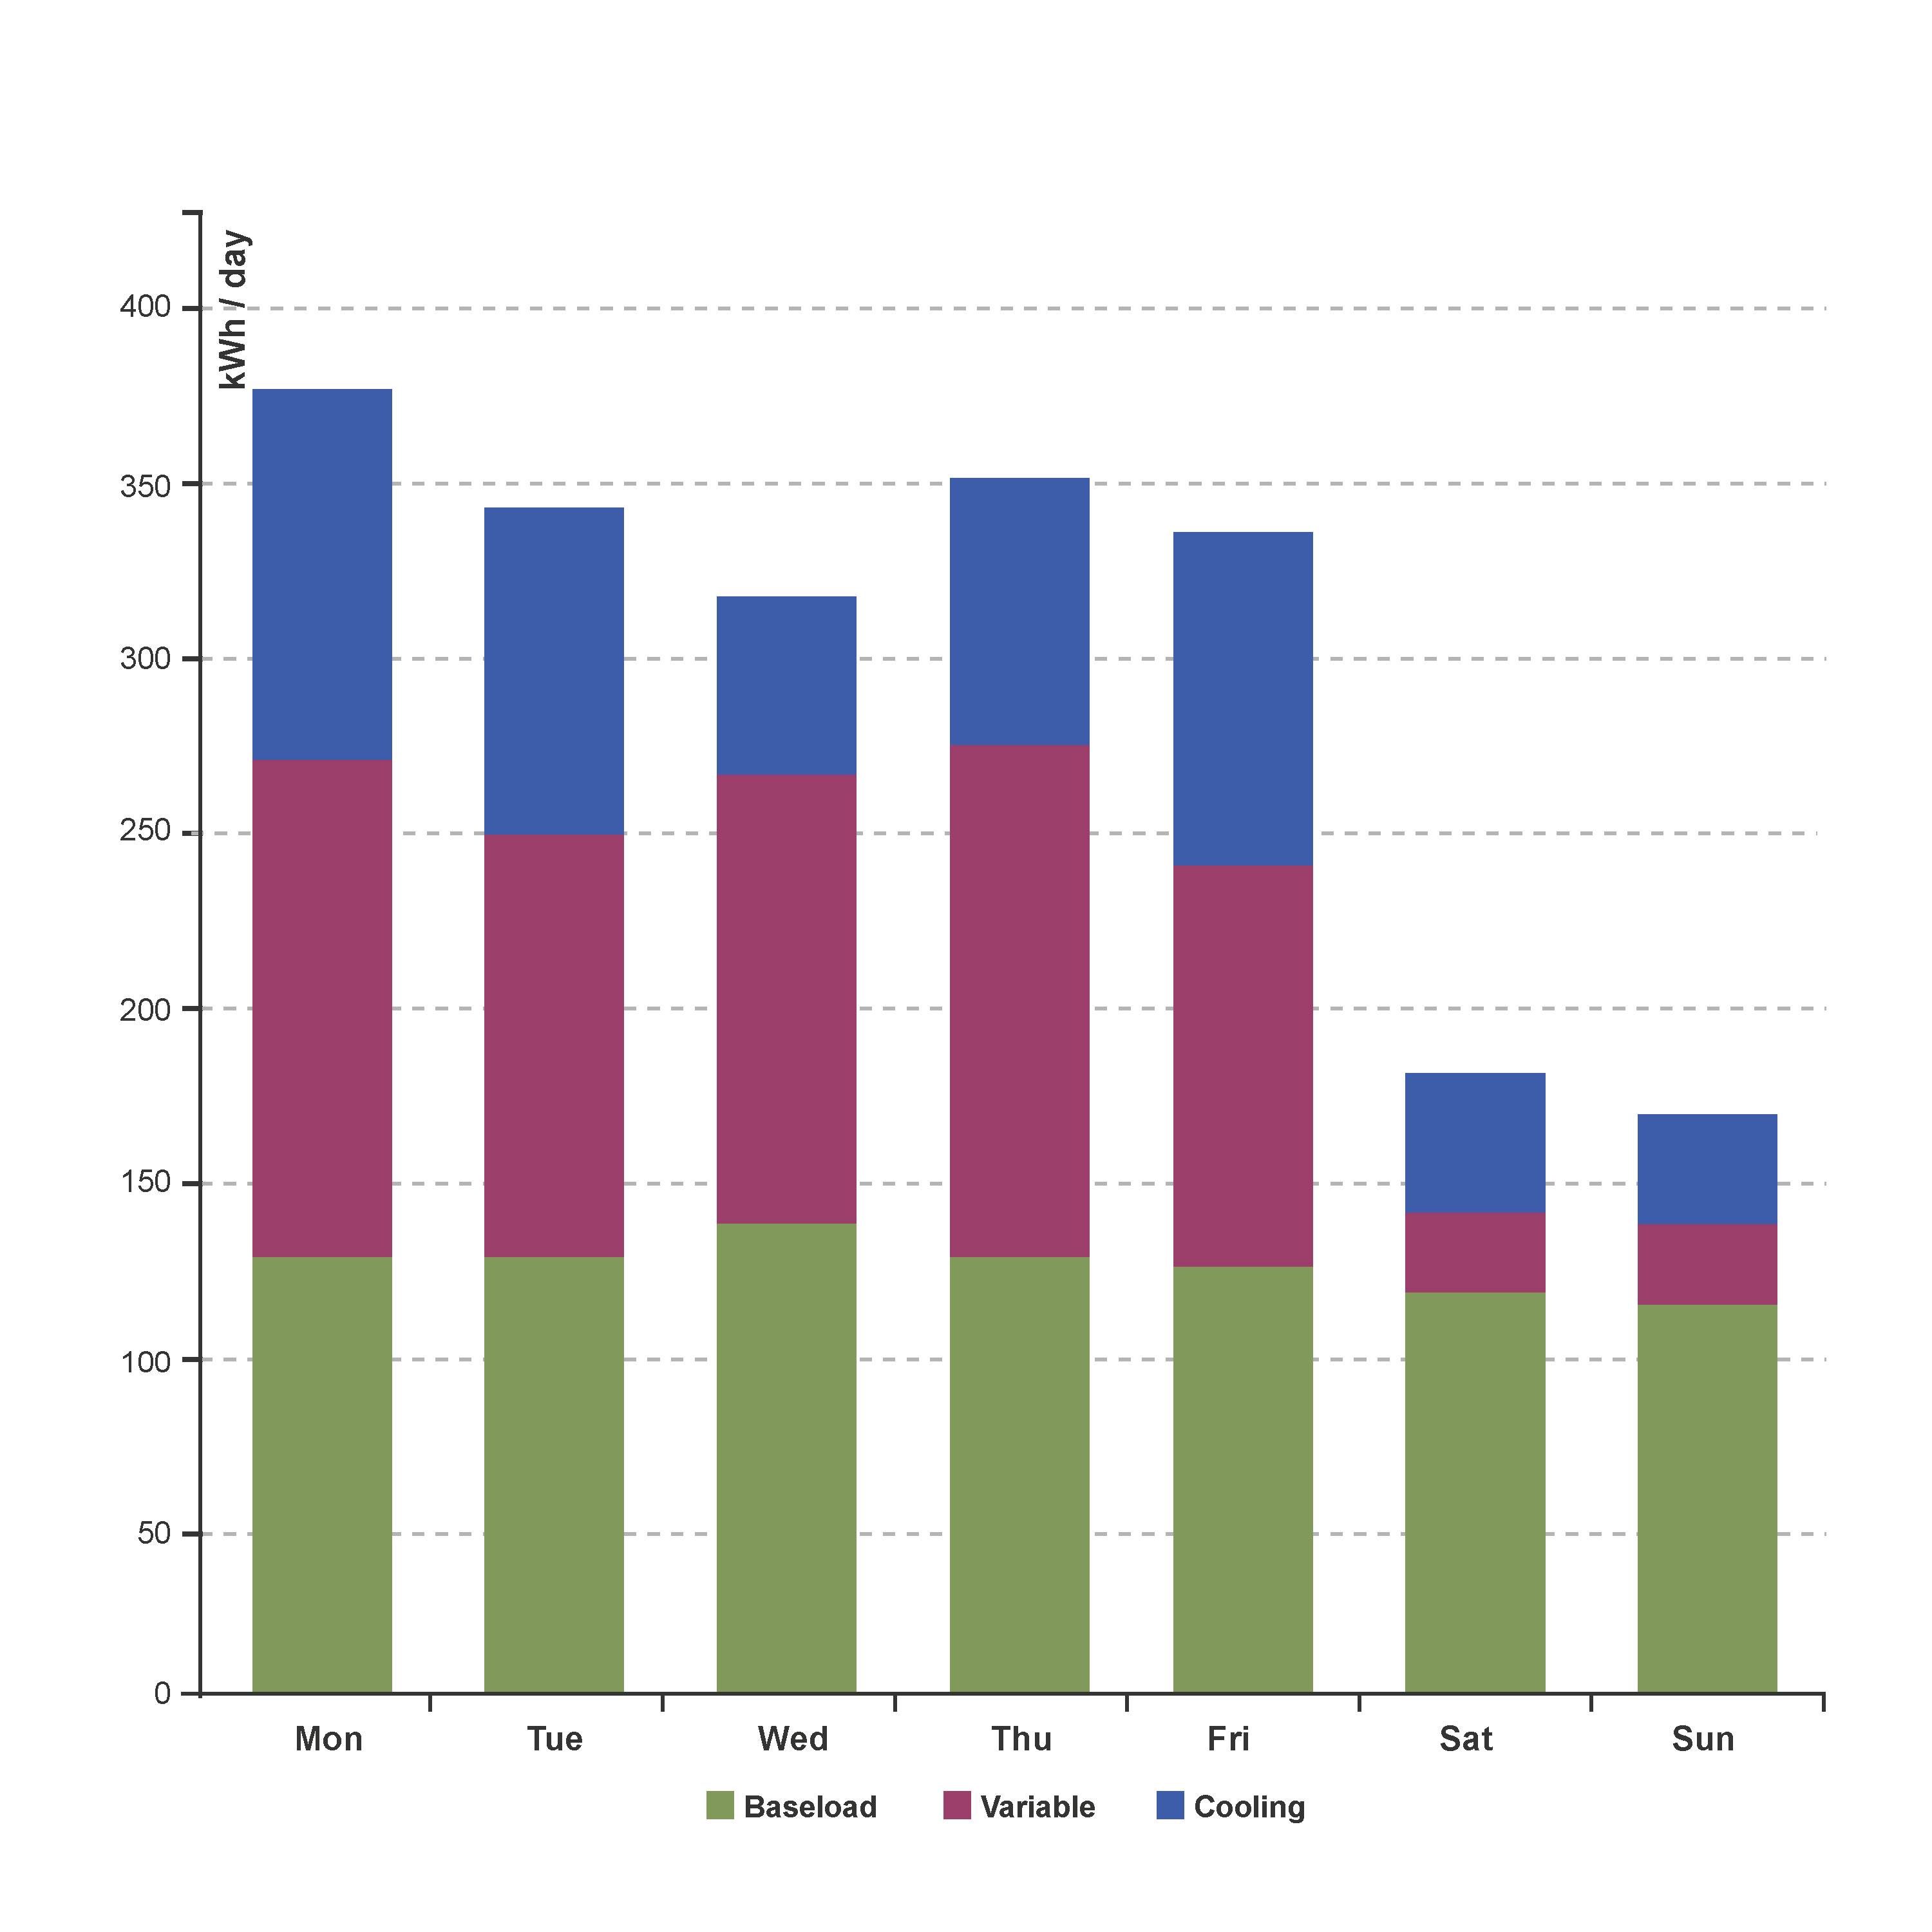
Not all energy use is the same. Enpira computes weather adjusted whole-building energy use models to break apart energy consumption into its different components. See your energy use disaggregated into separate types, and find opportunities to save energy and demand:
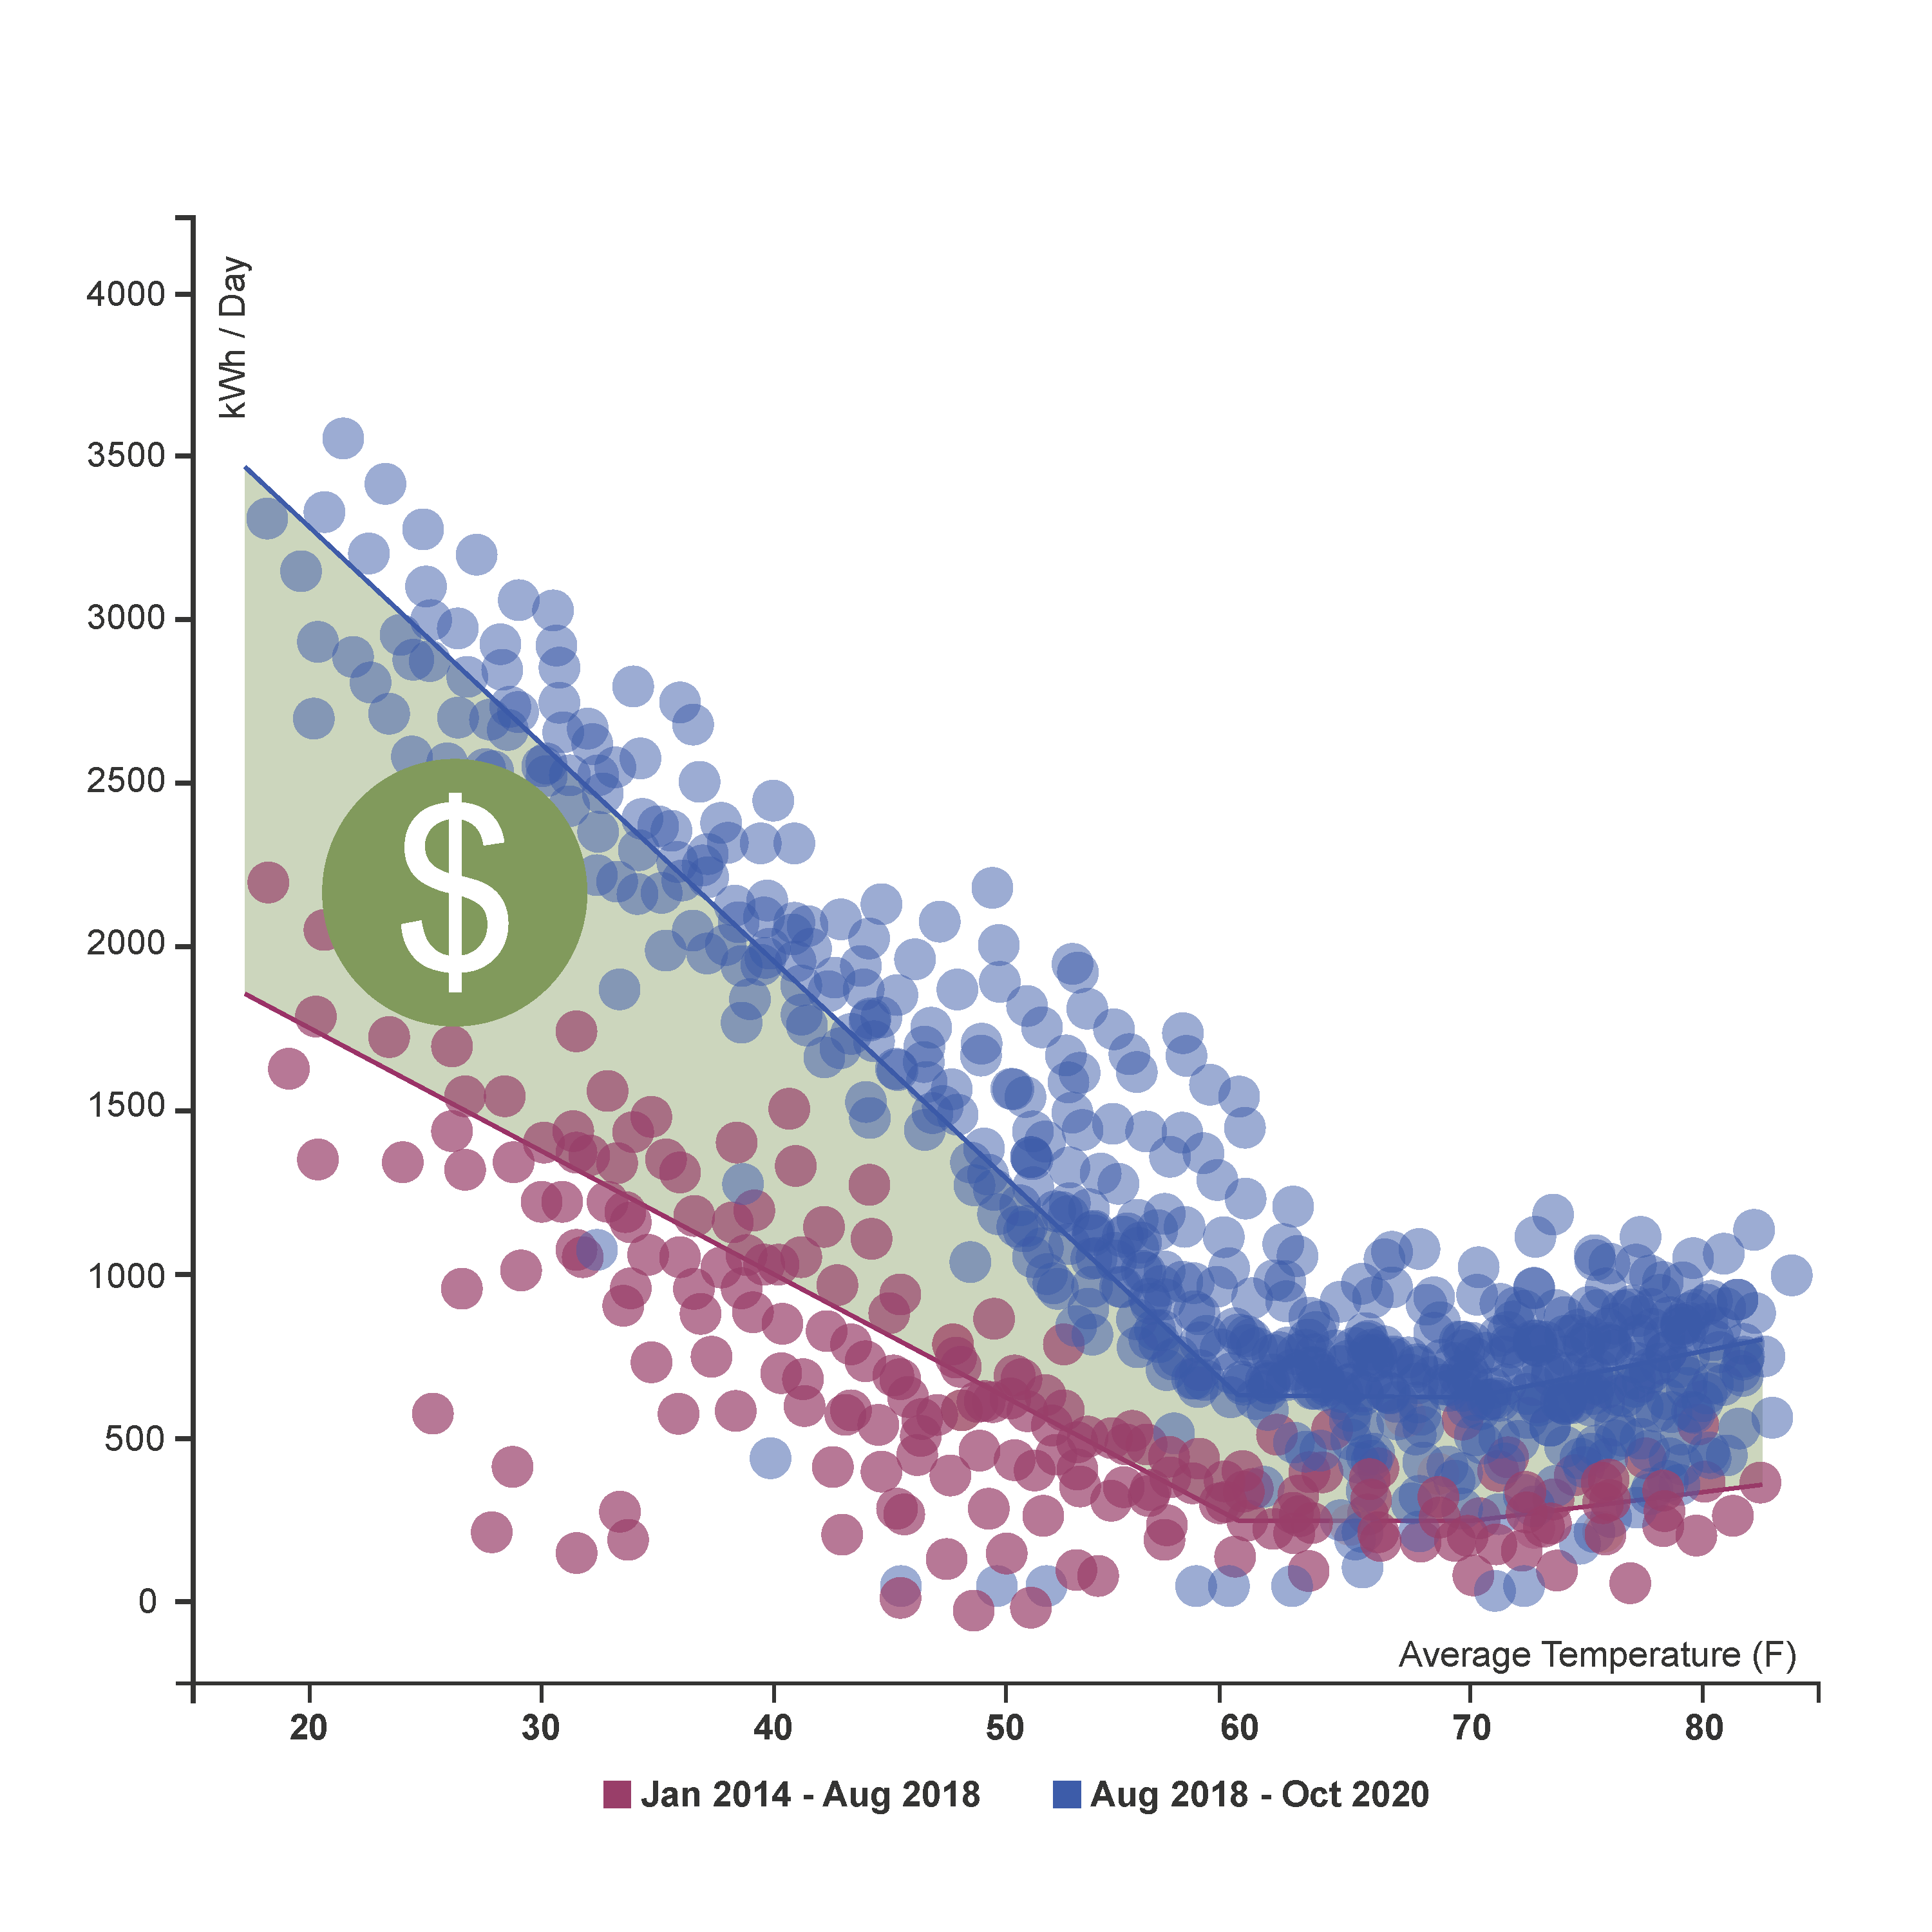
How much energy are your improvements saving?
Whole building energy use models combined with weather normalization unlocks Normalized Annual Consumption (NAC), the average amount of energy a building would use in a “normal” weather year.
Enpira calculates energy savings following improvements by comparing the pre-improvement NAC to the post-improvement NAC. This method is the industry gold standard for energy savings measurement & verification (M&V) and is available for ongoing monitoring and cumulation of energy savings.
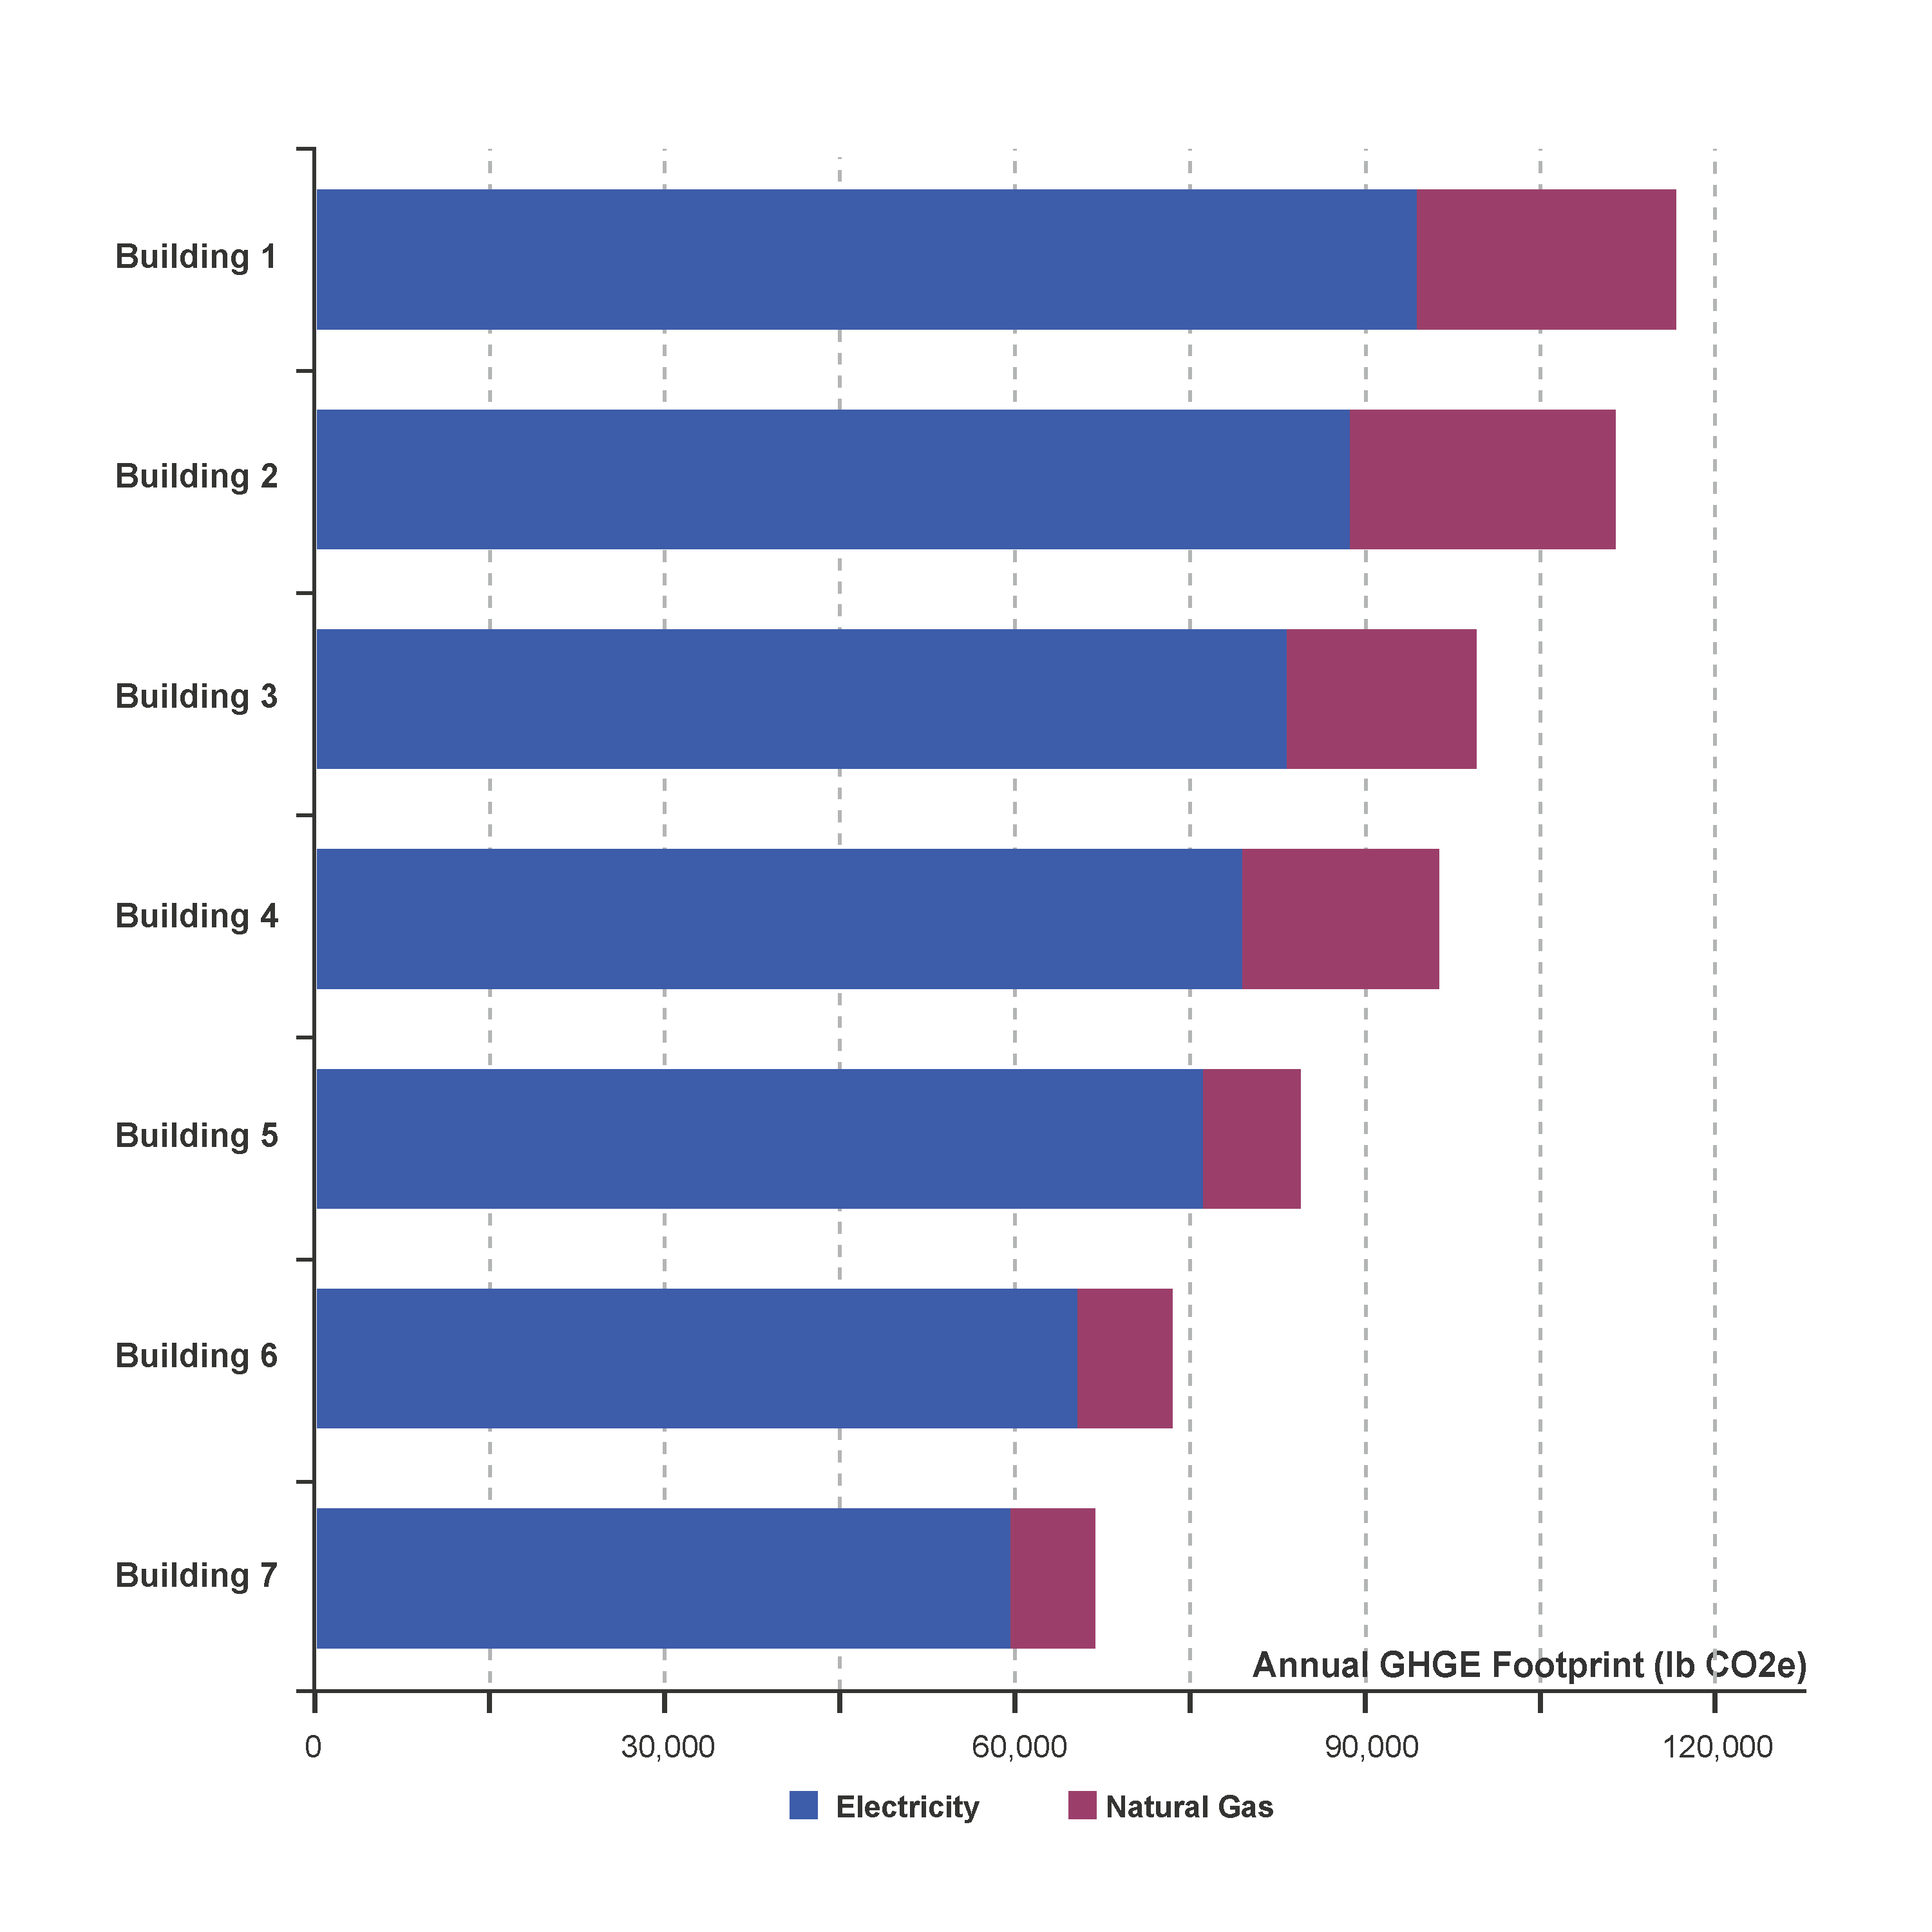
Are you reaching your sustainability targets?
Facility energy usage is a major source of local government greenhouse gas emissions footprint. Enpira uses industry standard regional conversion factors to determine your portfolio’s footprint from energy usage over time.
Benchmark your buildings’ performance within groups, by square footage, and over time. Gain the visibility you need to manage your portfolio’s emissions footprint.

