Energy Intelligence, Simplified.

Enpira is a fully managed platform that handles the complexity of utility data. We combine powerful software with hands-on expertise to help you reduce costs, meet sustainability goals, and make confident decisions.

Enpira Features & Services

Built Around Your Needs, Not Just Your Data

Enpira turns complex utility data into clear, actionable intelligence. We work alongside your team to reduce operational costs, support sustainability commitments, and deliver measurable results across your entire portfolio.

A blue line-art icon of a desktop computer screen featuring interactive data visualizations, including a three-slice pie chart and a four-bar vertical graph.

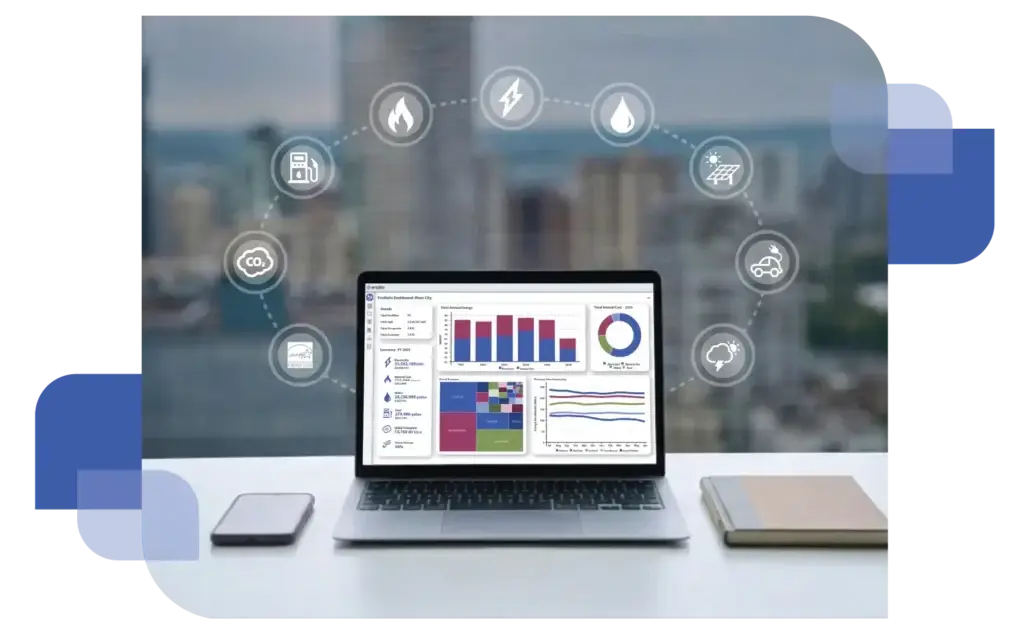
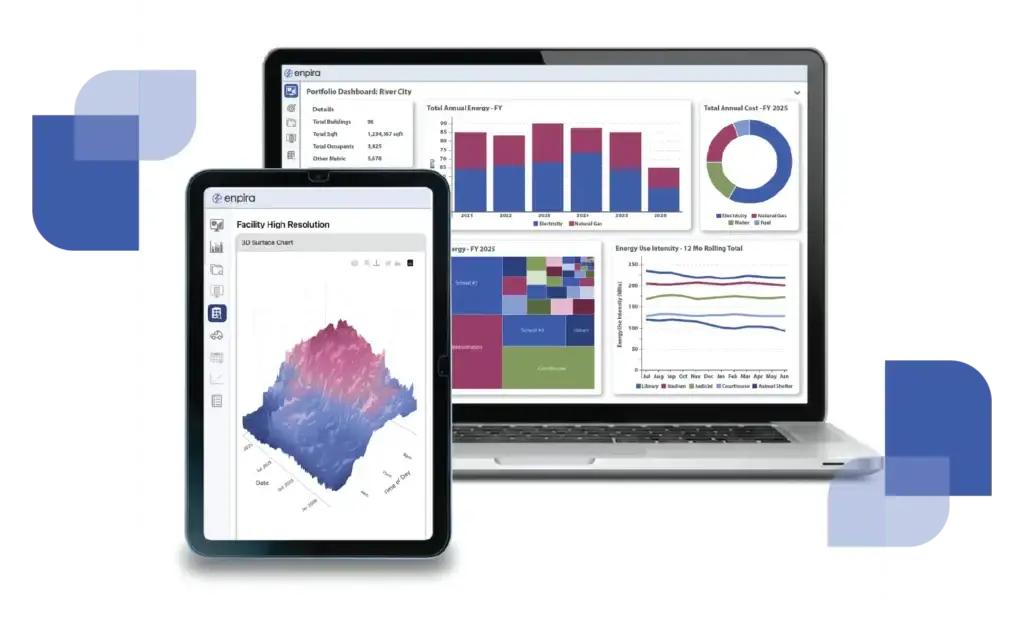
Interactive Dashboards

Our diverse array of intuitive graphics turn complex utility data into critical insights on your facilities and entire portfolio.

A blue line-art icon featuring a horizontal bar graph on the left and a simplified building on the right, representing Energy Use Intensity (EUI) data.

Building Operation Analysis

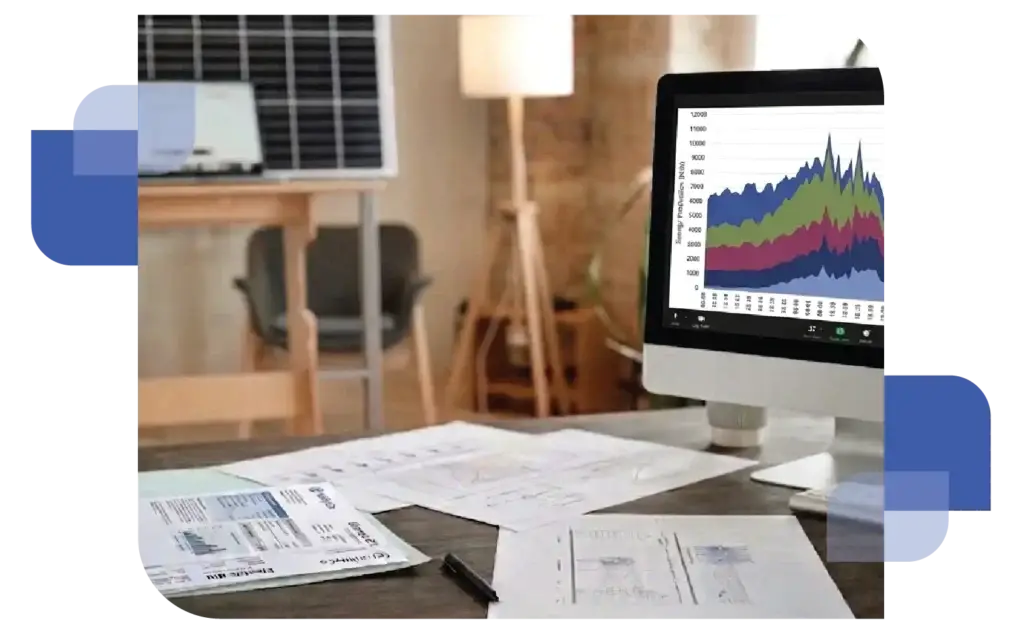
Use high-resolution interval data to diagnose energy waste, pinpointing when facilities are in operating mode even when unoccupied.

A blue line-art icon of a triangle with rounded corners containing a large exclamation mark, representing an alert or notification.

Anomaly & Leak Alerts

We monitor your portfolio and send alerts for usage spikes and potential water leaks, identifying issues to be remediated promptly.

A blue line-art icon featuring a document with a dollar sign and a security shield containing a checkmark in the foreground, representing verified bill auditing.

Bill Auditing & Validation

Cross-check utility bills against actual meter data, catching billing errors and flagging overcharges for recovery.

A blue line-art icon of a balance scale, with one dollar sign in the left pan and another in the right, representing financial comparison or rate simulation.

Rate Simulation & Advisory

We determine if your facilities are on the most favorable utility rate schedule and identify savings opportunities through targeted rate switching.

A blue line-art icon showing three sparkling four-pointed stars, commonly used to represent artificial intelligence or automated enhancements.

AI Insights

Integrated AI analyzes your data to uncover hidden trends and deliver prioritized, actionable recommendations.

The Enpira Advantage

We take pride in delivering innovative, high-quality software and analyses — and our energy data solutions have earned strong, consistent praise from the client teams who rely on them.

Fully Managed Service

We handle the complexity so you don't have to

Don’t waste time on data entry and spreadsheets. Enpira manages the full data lifecycle  automated data acquisition, account updates, and ongoing validation  freeing your team to focus on its most important energy initiatives.

A professional workspace featuring a laptop displaying energy data charts, surrounded by digital icons representing cloud data, connectivity, and automated utility tracking.

Software Plus Partnership

Expert collaboration for data-driven energy insights

Unlike “software-only” vendors, Enpira is your energy technology partner. Every license includes professional support and access to our team with deep energy expertise to help solve your specific data challenges.

A professional workspace featuring a solar panel setup, a desk lamp, and a desktop computer screen displaying various energy data charts and graphs, representing sustainable energy management.

Cost-Effective Solutions

Predictable pricing, no surprises

Enpira’s pricing is fair and reasonable. Every feature, every integration, and every support request is covered under a single straightforward license, with no hidden fees or surprise invoices. As your partner, we strive to realize significant value for our clients.

A wooden office desk with a calculator and pen resting on top of a "Monthly Budget" financial document and a computer monitor with a colorful graph representing cost-effective energy planning.

Commitment to Innovation

Continuous innovation to keep you ahead of the curve

Our development roadmap is shaped by new technologies and client conversations. When you identify a gap or a new challenge, we build toward it — ensuring the platform evolves to meet your needs.

Multiple digital screens, including a laptop and a tablet, displaying colorful energy analytics graphs and data visualizations.

How Enpira Works

From Raw Data to Actionable Intelligence

1

Automated Data Acquisition​

Enpira handles the heavy lifting — connecting directly to data providers to securely automate the intake of all historical and ongoing data.​

2

Data Processing & Validation​

We load your data into our secure database, inspect it for accuracy and anomalies — and make it immediately available through our portal.

3

AI & Advanced Analytics​

Enpira combines rigorous empirical analysis and AI-driven pattern recognition to identify trends, delivering actionable insights.

4

Strategic Impact & Reporting

We provide accurate summaries for stakeholder meetings and reporting — and personalized support to help you tell your story.

Customer Testimonials

What Our Clients Say

Less Complexity. More Clarity.

Let us show you how Enpira becomes an extension of your team — and what we can build together.